Under the Spotlight
How does poverty level differ by race and by age in 2010?
Visualization
Barplot
Captions
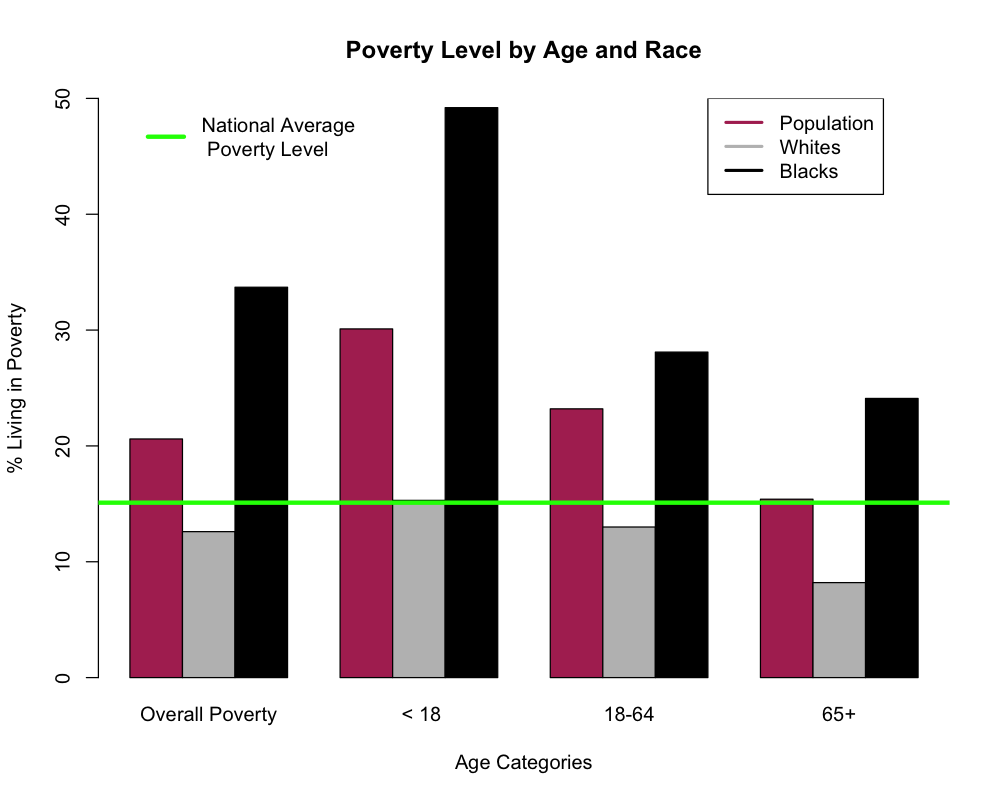
In this plot, we see first that the poverty level in Memphis/ West Memphis is overall higher (around 20%) than the national average (15%). Another key takeaway is the fact proportion of those living in poverty tends to decrease with age across all racial categories. This makes some sense; people who are younger tend to have more unstable economic circumstances. By race, we also see that blacks tend to be more impoverished than whites at all levels.
Here, we chose bar plots to represent poverty levels because we felt that it was the most straightforward way to tell what is perhaps the most important result of our findings. Memphis is a city in poor economic condition, and it’s easy to see this by looking at the bars. Memphis is over 50% black, so the fact that the blacks of Memphis are so impoverished does not look well upon the city. A mosaic plot would have been a bit much here, and it would not have captured the subtle but substantial differences in proportion. Similarly, pie charts would not work well here because we are directly comparing percentages that do not add up to 100%.