Another way to create or embellish a plot is by adding points. Suppose
we were interested in returning to the students vs. expenditures plot (where
there did not appear to be any clear relationship) and breaking the data
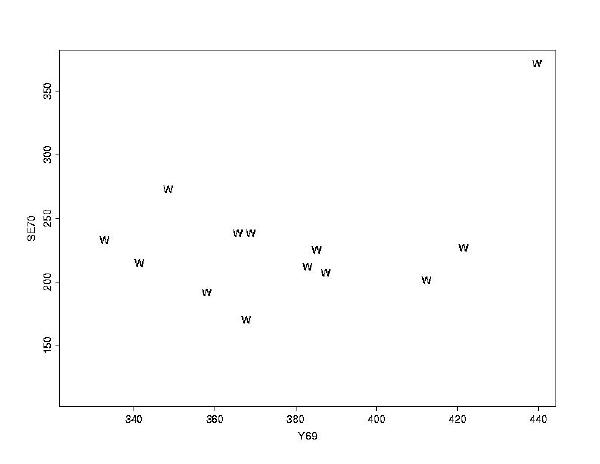
down by region. To plot the points from the West (and label them with
W's instead of *'s) we could use:
> plot(Y69[Region=="WEST"], SE70[Region=="WEST"], pch="W")(The
pch= field tells S-PLUS what character to use for the
points.) This plot is OK for displaying the West points, but if we tried
to add points from any other region, some might be outside the range of this
graph. This happens because plot chose a range for the axes
to fit the West points as well as possible, without any consideration for
the other points. It is better to first create an empty plot which fits
the full data, and then fill in the West points.
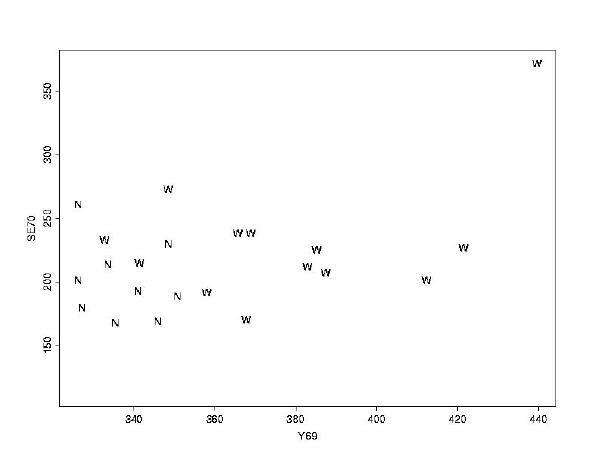
> plot(Y69, SE70, type="n")
> points(Y69[Region=="WEST"], SE70[Region=="WEST"], pch="W")
> points(Y69[Region=="NOREAST"], SE70[Region=="NOREAST"], pch="N")