To see multiple plots on the same page, first break the graphics window into multiple sections. Let's try a 2 by 2 grid of smaller windows.
> par(mfrow=c(2,2))
This has no obvious immediate effect. However, the next plot will appear
in the upper left hand frame of a 2 by 2 matrix of plotting frames. Let's
fill these frames with plots of predictors and SE70, two of
which we have already seen.
> plot(PI68, SE70)
> plot(Y69, SE70)
> plot(Urban70, SE70)
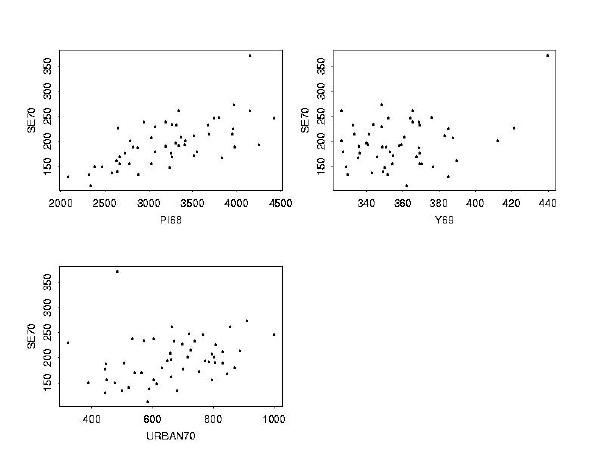
Urban70 vs. SE70
) is the active one with respect to embellishments. Titles, lines, etc.
will appear on that plot. Because of this you should finish working with
one plot before creating any others.
The next plot will appear in the lower right-hand frame. If you then
created a fifth plot, the first four would disappear and the fifth would
go in the upper left-hand frame. Suppose you have these three graphs, and
want to add a set of four more. If you simply tried to add four plots, the
first would go on the current page and then that page would disappear and
the last three plots would be displayed. If you want the four new plots
to go together, you have several options. The first is to execute the
par(mfrow=c(2,2)) command again. This would take effect with the
first of the four plots, causing it to appear in the upper left-hand frame
of an otherwise blank window. A second option is to use the frame()
command twice, to move the working frame two frames forward. When you type
frame() the first time, S-PLUS will make the lower right-hand
frame the active one, and you will be no longer be able to embellish the
third picture. When you use the function a second time, S-PLUS will advance
the active frame to the upper left-hand frame of a blank page and you will
then have room for four plots on that page.