S-PLUS allows you to add titles at several places in the plot: a main title (above the picture) and x-axis and y-axis titles.
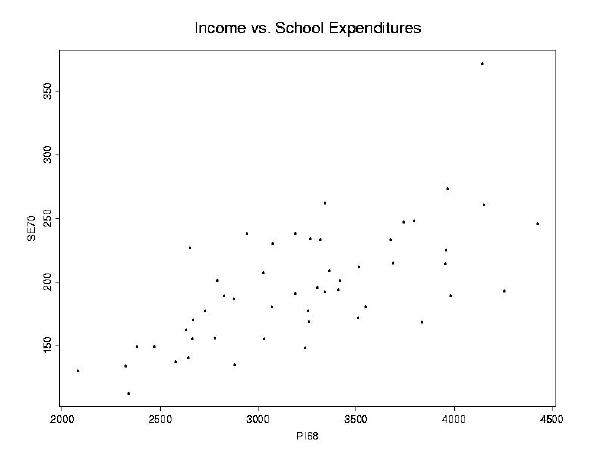
> plot(PI68, SE70)
> title(main="Income vs. School Expenditures")
xlab=) and y-axis (ylab=)
titles in a similar way. Note that plot usually produces x-axis
and y-axis labels, so there is rarely a need to add your own. In fact, if
you add a new title to a plot where one already exists, S-PLUS will put the
new title on the plot without removing the existing one. This means
that if you made a mistake with one title and wish to change it, will need
to create the plot all over again and then add the correct title.