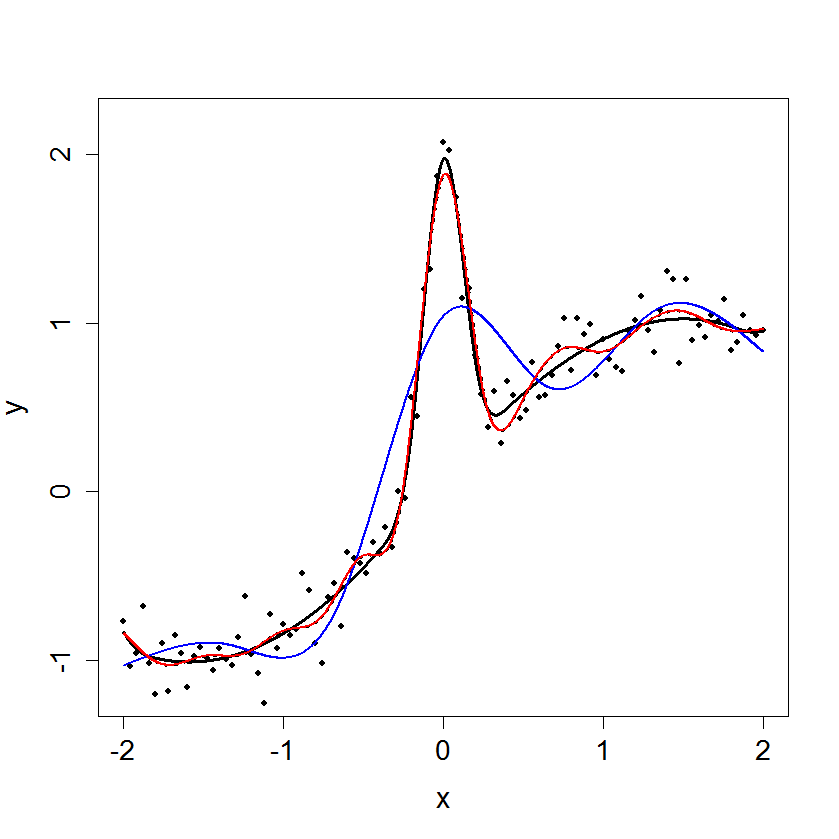
#  This script displays three cubic spline fits to the test function
#      f(x) = sin(x) + 2 * exp( -30 * x^2 )

library(splines)

n.observations <- 101

x.obs <- seq(from = -2, to = 2, length.out = n.observations)
f.obs <- sin(x.obs)+2*exp(-30*(x.obs^2))
f.sd <- sd(f.obs)

added.noise.sd <- f.sd/6
added.noise <- rnorm(n.observations, 0, added.noise.sd)
observations <- f.obs+added.noise

x.knots <- c(-1.8, -0.4, -0.2, 0, 0.2, 0.4, 1.8)
x.mat <- matrix(0, nrow = length(x.obs), ncol = length(x.knots)+3)
x.mat[,1:3] <- cbind(x.obs, x.obs^2, x.obs^3)
for(i in 1:length(x.knots)){
	x.mat[,(i+3)] <- mapply(max, (x.obs-x.knots[i])^3, 0)
}

x.df <- data.frame(x.mat)

x.values = seq(-2, 2, by = 0.001)
x.matpred <- matrix(0, nrow = length(x.values), ncol = length(x.knots)+3)
x.matpred[,1:3] <- cbind(x.values, x.values^2, x.values^3)
for(i in 1:length(x.knots)){
	x.matpred[,(i+3)] <- mapply(max, (x.values-x.knots[i])^3, 0)
}

x.df.predictions <- data.frame(x.matpred)

splines.model <- lm(observations~., cbind.data.frame(observations, x.df))
splines.predictions <- predict(splines.model, x.df.predictions)

#  Make a cubic spline basis with five knots.
x.basis.1 <- ns(x.obs, 6)
splines.model.1 <- lm(observations~., cbind.data.frame(observations, x.basis.1))
splines.values.1 <- predict(x.basis.1, seq(-2, 2, 0.001))
splines.predictions.1 <- predict(splines.model.1, splines.values.1)

#  Make a cubic spline basis with 15 knots.
x.basis.2 <- ns(x.obs, 16)
splines.model.2 <- lm(observations~., cbind.data.frame(observations, x.basis.2))
splines.values.2 <- predict(x.basis.2, seq(-2, 2, 0.001))
splines.predictions.2 <- predict(splines.model.2, splines.values.2)

#  Prepare some graphical parameters.
label.size <- 1.5
axis.size <- 1.4
line.color <- 153


#  Plot the observations and all spline models.
plot(x.obs, observations,
     xlim = c(-2, 2), ylim = c(-1.2, 2.2),
     xaxt = "n", yaxt = "n",
     main = "", xlab = "x", ylab = "y", cex.lab = label.size, pch = 16, cex = 0.7)
lines(x.values, splines.predictions, col = line.color, lwd = 3)
lines(x.values, splines.predictions.1, col = 4, lwd = 2)
lines(x.values, splines.predictions.2, col = 2, lwd = 2)

x.axis <- seq(from = -2, to = 2, by = 1)
y.axis <- seq(from = -1, to = 2, by = 1)
axis(1, at = x.axis, labels = x.axis, cex.axis = axis.size)
axis(2, at = y.axis, labels = y.axis, cex.axis = axis.size)

dev.print(device = postscript, "15.6.added.noise", horizontal = TRUE)