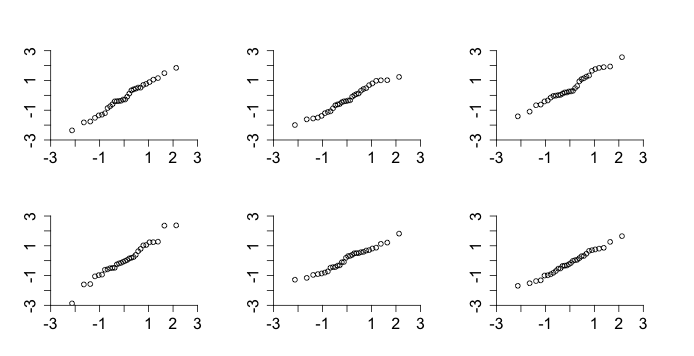
#  This script plots six QQ-normal plots for samples of a standard normal.
#  Each plot should show small deviations from normality.

n.observations <- 30

#  Set up the graphics device.
par(mfrow = c(2, 3))
par(mar = rep(3, 4))
#  This allows us to exactly specify the plot window.  Otherwise, R will
#  slightly expand the plot.
par(xaxs = "i")
par(yaxs = "i")


#  Prepare some graphical parameters.
standard.axis <- seq(from = -3, to = 3, by = 1)
axis.size <- 1.5

for(i in 1:6){
	qqnorm(rnorm(n.observations), xlim = c(-3, 3), ylim = c(-3, 3),
         main = "", xlab = "", ylab = "", xaxt = "n", yaxt = "n", bty = "n")
	axis(1, at = standard.axis, cex.axis = axis.size)
	axis(2, at = standard.axis, cex.axis = axis.size)
}

#  Close the graphics device.
dev.print(device = postscript, "3.12.eps",
          horizontal = TRUE, width = 11, height = 7, paper = "special")