lfp=read.table("data/lfp-ryan.dat")[,1]
library("splines")
time=1:1000
lfp1=lfp[1:1000]
splinefit1=lm(lfp1 ~ ns(time,knots=c(200,400,600,800)))$fit
lfp1detrend=lfp1-splinefit1
I1detrend=spec.pgram(lfp1detrend,plot=FALSE,detrend=FALSE)$spec
sm.Ivals=rep(0,50000)
dim(sm.Ivals)=c(1000,50)
upperband=rep(0,50)
lowerband=rep(0,50)
f=0:500/1000
sm.I1d.50=ksmooth(f[1:50],I1detrend[1:50],n.points=50,x.points=f[1:50], "normal",bandwidth=.002)$y
for(i in 1:1000){
rvals=rgamma(50,shape=1)
Ivals=sm.I1d.50*rvals
sm.Ivals[i,]=ksmooth(f[1:50],Ivals,n.points=50,x.points=f[1:50],"normal",bandwidth=.002)$y
}
for(j in 1:50){
sort.vals=sort(sm.Ivals[,j])
upperband[j]=sort.vals[975]
lowerband[j]=sort.vals[25]
}
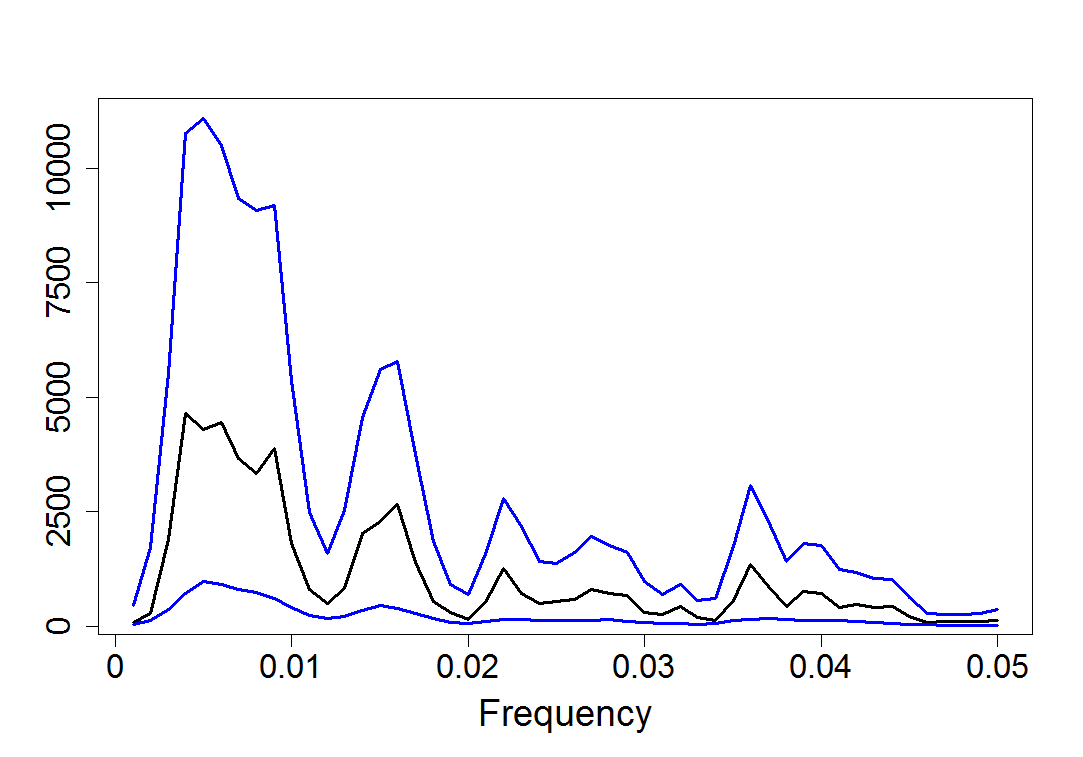
plot(upperband, type="l", col = 4, lwd = 3, xlab = "Frequency", ylab = "", xaxt = "n", yaxt = "n", cex.lab = 1.8)
lines(sm.I1d.50, lwd = 3)
lines(lowerband, col = 4, lwd = 3)
axis(1, at = seq(from = 0, to = 50, by = 10), labels = seq(from = 0, to = 0.05, by = 0.01), cex.axis = 1.7)
axis(2, at = seq(from = 0, to = 10000, by = 2500), labels = seq(from = 0, to = 10000, by = 2500), cex.axis = 1.7)
dev.print(device = postscript, "18.15.eps", horizontal = TRUE)