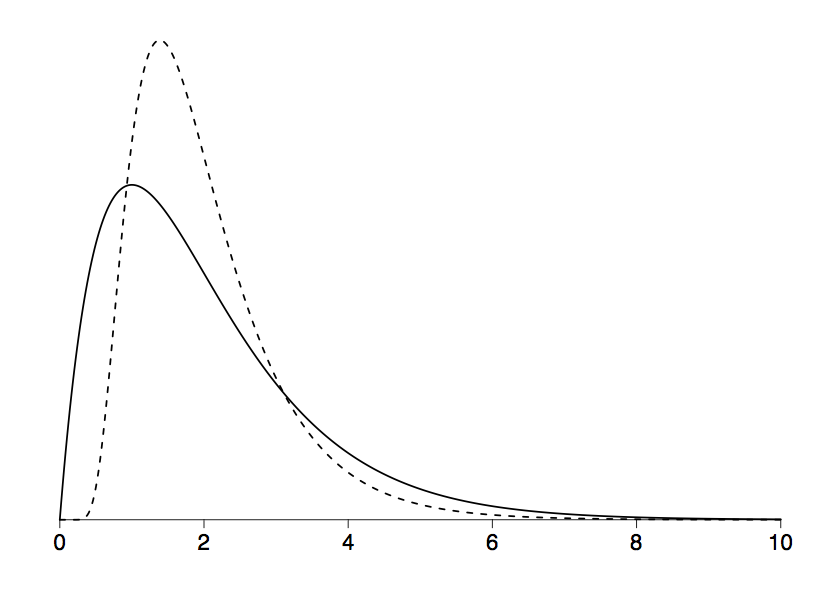
#  This script produces a figure of the PDF of an inverse gaussian
#  along with that of a gamma distribution.  The distributions are
#  made to have the same mean and variance.

postscript("invgauss.ps")

#  Compute gamma and inverse gaussian densities.
mu <- 2
lambda <- 8
x <- c(seq(.00001, 10, length.out = 500))
gammaDensity <- dgamma(x, mu)
inverseGaussianDensity <-dinvgauss(x, mu, lambda)

#  Plot both.
plot(x, inverseGaussianDensity, xlab = "", ylab = "", type = "l",
     axes = FALSE, bty = "n", lwd = 2, col = "blue")
lines(x, gammaDensity, lwd=2)
dev.off()