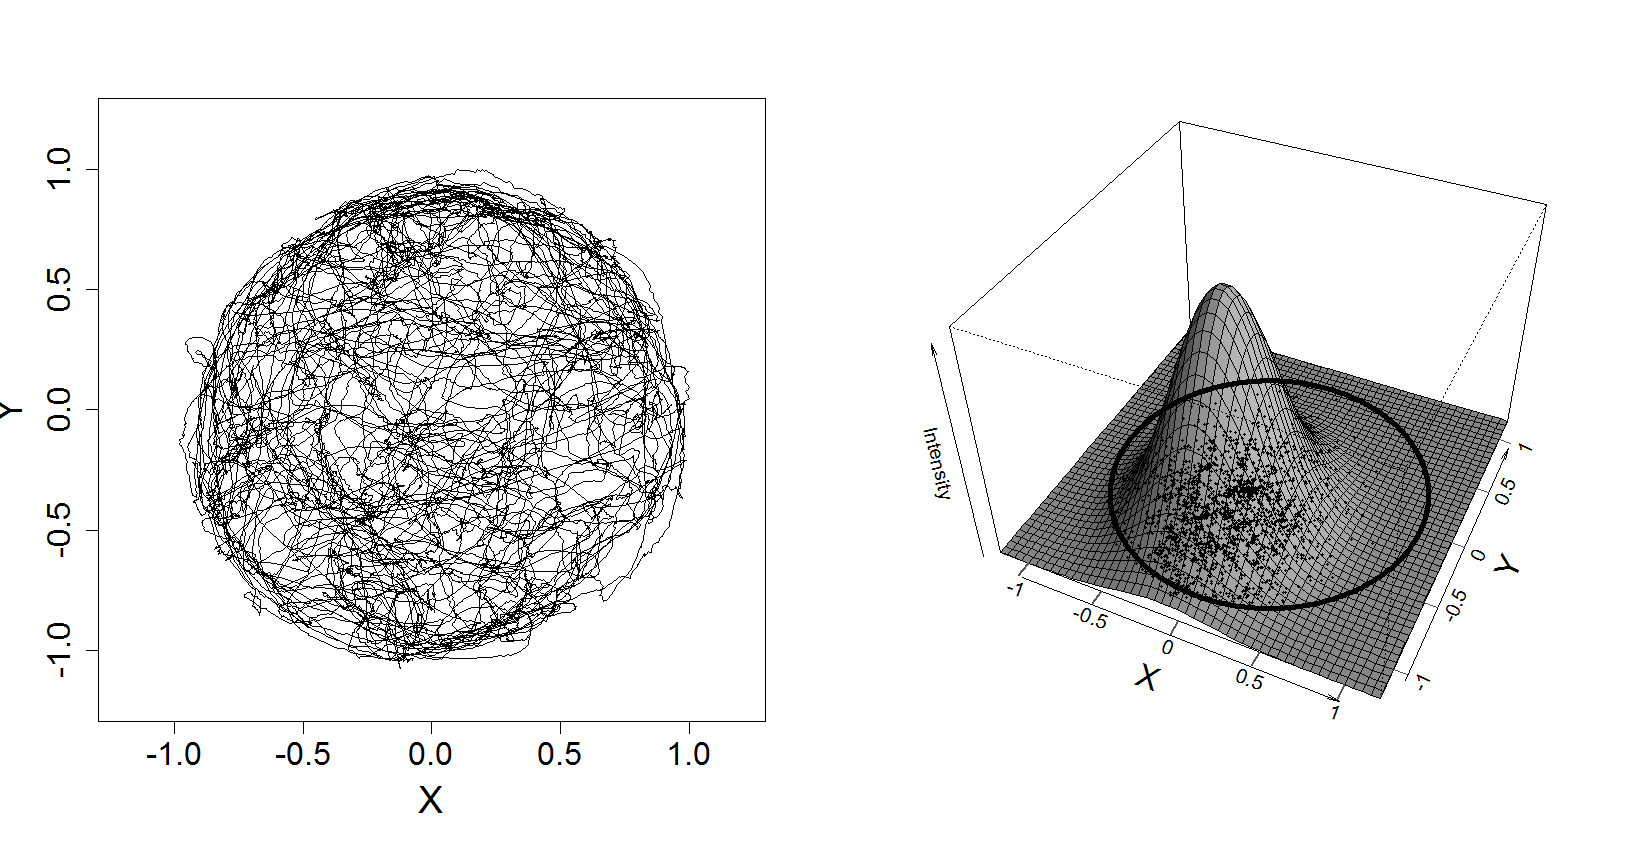
#  This script produces figure 14.4 in Analysis of Neural Data,
#  an analysis of spike data from a rat Hippocampus.

if(require("R.matlab") == 0){
	install.packages("R.matlab")
}
require("R.matlab")

##Read in the data
hippocampal.data <- readMat("~/anonda/data/hippocampal.data.mat")

#  Fit a generalized linear model using the Poisson family.
model.1  <-  glm(spikes ~ xN + yN + I(xN^2) + I(yN^2) + xN*yN,
           data = hippocampal.data,
           family = "poisson")

#  Set up a 1x2 plot.
dev.new(width = 14.5, height = 7.5)
par(mfrow = c(1, 2))

plot(hippocampal.data$xN, hippocampal.data$yN,
     type = "l", lwd = 0.3,
     xlab = "X", ylab = "Y",
     xlim = c(-1.2, 1.2), ylim = c(-1.2, 1.2),
     cex.lab = 1.8, xaxt = "n", yaxt = "n")

#  Plot spike points.
spike.points  <-  which(hippocampal.data$spikes == 1)
points(hippocampal.data$xN[spiking.points], hippocampal.data$yN[spike.points],
       pch = 16, cex = 0.7)

#  Fix axes.
axis(1, at = seq(-1, 1, by = 0.5), cex.axis = 1.6)
axis(2, at = seq(-1, 1, by = 0.5), cex.axis = 1.6)

grid  <-  seq(from = -1.2, to = 1.2, by = 0.05)
lambda.prediction  <-  outer(grid, grid,
  function(x, y) {exp(cbind(1, x, y, x^2, y^2, x*y) %*% model.1$coef)})

xy.max <- dim(lambda.prediction)[1]

colPal <- rainbow(100)[seq(from = 80, to = 1)]
zfacet  <-  lambda.prediction[-1, -1] + lambda.prediction[-1, -xy.max] + lambda.prediction[-xy.max, -1] + lambda.prediction[-xy.max, -xy.max]
facetcol  <-  cut(zfacet, 80)
trans4d <- persp(grd, grd, lambda.prediction, col = "gray", r = 1.6, theta = 25, phi = 40, expand = 0.7, xlab = "", ylab = "", zlab = "Intensity", border = "black", shade = 0.5, d = 2, ltheta = 270, lphi = 180)

N <- sum(hippocampal.data$spikes)
spikeTimes <- which(hippocampal.data$spikes==1)

t <- seq(0, 2*pi, 0.01)
tx <- cos(t)
ty <- sin(t)
projection.2d <- trans3d(hippocampal.data$xN[spikeTimes], hippocampal.data$yN[spikeTimes], rep(0, N), trans4d)
points(projection.2d$x, projection.2d$y, pch = 16, cex = 0.3)
projection.2db <- trans3d(tx, ty, rep(0, length(t)), trans4d)
points(projection.2db$x, projection.2db$y, pch = 16, cex = 0.5)

x_axis  <-  seq(-1, 1, by = 0.5)
y_axis  <-  seq(-1, 1, by = 0.5)

xy0  <-  trans3d(x_axis, -1.2, 0, trans4d)
xy1  <-  trans3d(x_axis, -1.3, 0, trans4d)
xy1tl  <-  trans3d(x_axis-0.04, -1.31, 0, trans4d)
segments(xy0$x, xy0$y, xy1$x, xy1$y, col = "#555555", lwd = 2)

#  Add labels.
text(xy1$x, xy1$y, labels = x_axis, pos = 1, offset = .25, cex = 1, srt = -20)
xlab  <-  trans3d(0, -1.5, 0, trans4d)
text(xlab$x, xlab$y, "X", pos = 1, offset = 0.25, cex = 1.6, srt = -20)

xy0  <-  trans3d(1.2, y_axis, 0, trans4d)
xy1  <-  trans3d(1.28, y_axis, 0, trans4d)
xy1tl  <-  trans3d(1.3, y_axis-0.1, 0, trans4d)
segments(xy0$x, xy0$y, xy1$x, xy1$y, col = "#555555")

#  Add labels.
text(xy1tl$x, xy1tl$y, labels = y_axis, pos = 4, offset = .5, cex = 1, srt = 65)
xlab  <-  trans3d(1.5, -0.15, 0, trans4d)
text(xlab$x, xlab$y, "Y", pos = 4, offset = 0.5, cex = 1.6, srt = 65)

dev.print(device = postscript, "14.4.eps", horizontal = TRUE)

