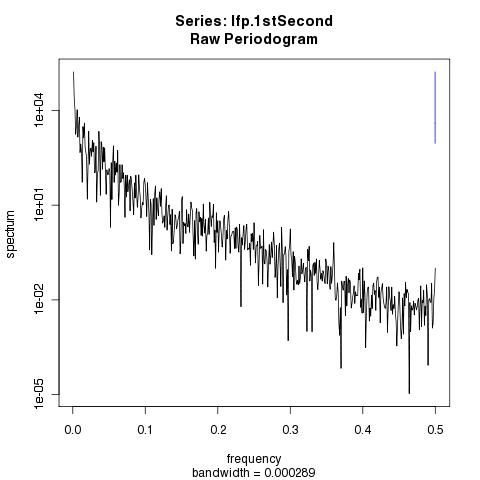
#  Code for figure 18.5

lfp <- read.table("data/lfp-ryan.dat")[,1]
lfp.1stSecond <- lfp[1:1000]

#  spec.pgram plots a log periodogram, and can plot a raw periodogram
#  with spec.pgram(X, log = "no").  The function also has optional
#  smoothers.  Learn more by typing ?spec.pgram into your R console.
jpeg("figure18.5.jpeg")
spec.pgram(lfp.1stSecond)
dev.off()