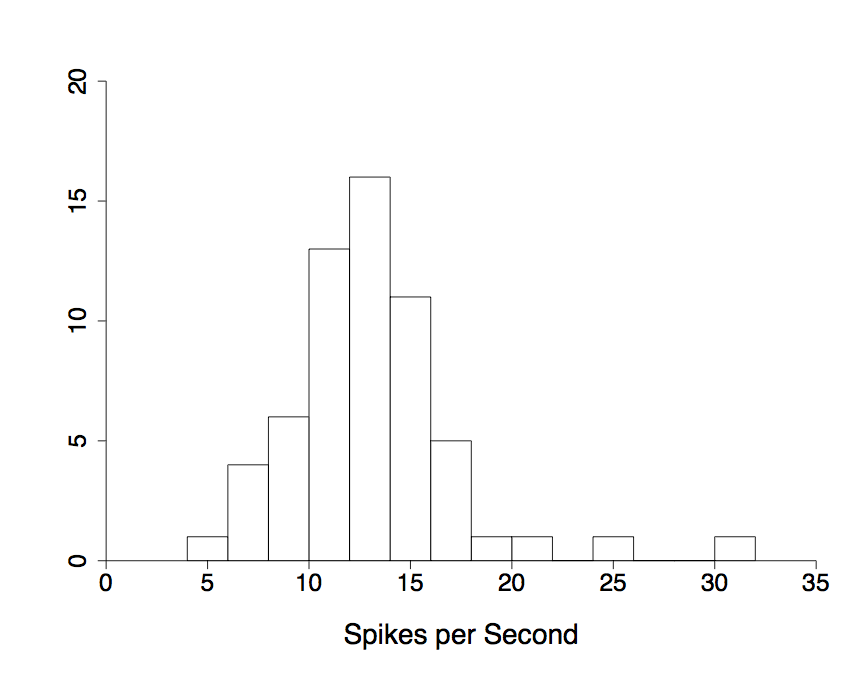
#  Creates a histogram of spike counts from a cortical neuron in the
#  M1 motor area.  There are 60 trials, and the histogram records the
#  number of spikes in each trial.
#
#  Note: This file orginally read "m1counts2.csv", which is now lost.
#  The image produced may differ from that in the book.  The site
#  shows the version created by Matlab.
spikeCounts <- read.table("../data/m1counts.csv")$V1[2:61]
countmeans <- apply(matrix(spikeCounts, nrow=15, ncol=4), 1, mean)

quantile(spikeCounts)
quantile(countmeans)
postscript("countmeans.ps")
par(mfrow = c(2,1))

hist(spikeCounts, breaks = 12, xlab = "", ylab = "", main = "Counts")
hist(countmeans, breaks = 8,
     xlim = range(spikeCounts), xlab = "", ylab = "",
     main = "Count Means")
dev.off()