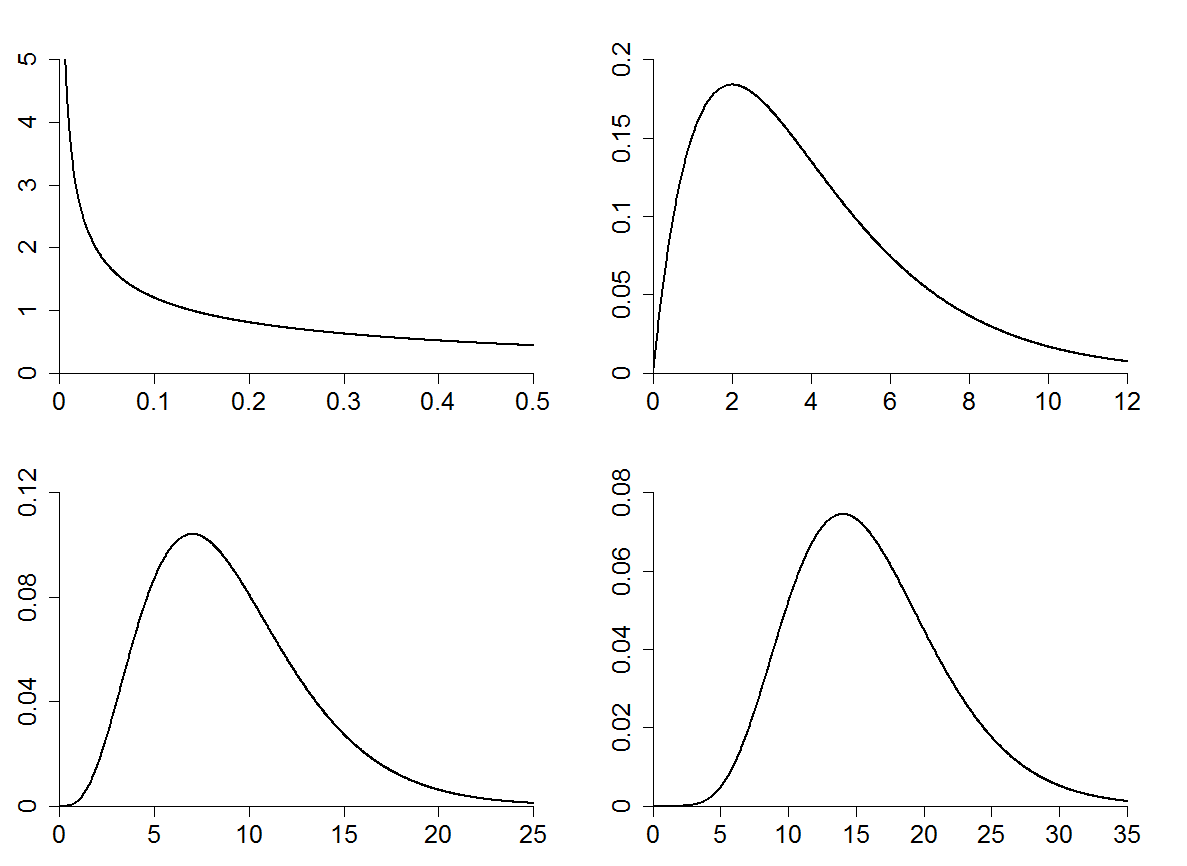
#  This script plots four chi-squared densities, with 1, 4, 9, and 16
#  degrees of freedom, respectively.
#
#  We first set up the varying elements (the distribution parameters,
#  and the limits and tick-marks on the x-axes), and then loop through
#  to plot each subplot with the same style.


#  Set up the graphics device.
par(mfrow = c(2, 2))
par(xaxs = "i")
par(yaxs = "i")
par(mar = rep(3, 4))

#  Set some graphical parameters.
line.type <- 1
line.width <- 2

#  Set the changing parameters for each plot.
degreesOfFreedomList <- c(1, 4, 9, 16)
xMaxima <- c(0.5, 12, 25, 35)
yMaxima <- c(5, 0.2, 0.12, 0.08)
xTickMarks <- c(0.1, 2, 5, 5)
yTickMarks <- c(1, 0.05, 0.04, 0.02)
resolution <- 1000
axis.size <- 1.5

#  Loop through and plot.
for (i in 1:4) {

    xMax <- xMaxima[i]
    yMax <- yMaxima[i]
    xTickMark <- xTickMarks[i]
    yTickMark <- yTickMarks[i]
    degreesOfFreedom <- degreesOfFreedomList[i]

    x.values <- seq(from = 0, to = xMax, length.out = resolution)
    chi.squared.pdf.values <- dchisq(x.values, df = degreesOfFreedom)

    plot(x.values, chi.squared.pdf.values,
         xlim = c(0, xMax), ylim = c(0, yMax),
         type = "l", lty = line.type, lwd = line.width,
         main = "", xlab = "", ylab = "",
         bty = "n", xaxt = "n", yaxt = "n")
    x.axis <- seq(from = 0, to = xMax, by = xTickMark)
    y.axis <- seq(from = 0, to = yMax, by = yTickMark)
    axis(1, at = x.axis, labels = x.axis, cex.axis = axis.size)
    axis(2, at = y.axis, labels = y.axis, cex.axis = axis.size)
}


#  Close the graphics device.
dev.print(device = postscript, "5.4.eps", horizontal = TRUE)