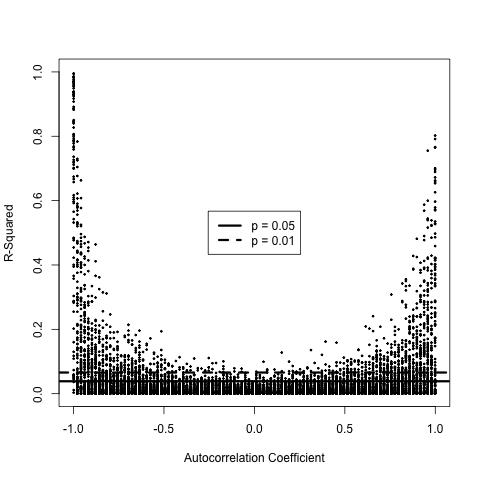
#	To simulate two AR(N) series, we use the built-in arima functions.
# This simulation will show how autocorrelated but independent
# time-series will often show spurious correlations.

n.simulations <- 100
n.ar.coefficients <- 100
n.points <- 100

#	Note this is a three-dimensional array.
#	The third dimension lists metadata:
#  R Squareds, Adjusted R Squareds, correlations (absolute value).
#  the fourth spot in the third dimension is reserved for p-values.
metaData <- array(0, dim = c(n.ar.coefficients, n.simulations, 4))

ar.coefficients <- seq(
	from = -0.999,
	to = 0.999,
	length.out = n.ar.coefficients)

#	This may take some time to run.  It is going through 10,000
# regressions (with n.ar.coefficients and n.simulations both at 100).
for (i in 1:n.ar.coefficients) {
	for (j in 1:n.simulations) {
		coef_i <- list(ar = c(ar.coefficients[i]))
		seriesA <- arima.sim(model = coef_i, n = n.points)
		seriesB <- arima.sim(model = coef_i, n = n.points)

		model <- lm(seriesB ~ seriesA)
		metaData[i, j, 1] <- summary(model)$r.squared
		metaData[i, j, 2] <- summary(model)$adj.r.squared
		metaData[i, j, 3] <- sqrt(summary(model)$r.squared)
		#metaData[i, j, 4] <- getpvalue(model)
	}
}


#	Now set up the pdf and some graphical parameters.
png("independentARseries.png")
point.size = 0.3
point.type = 19
line.width = 3


plot(x = ar.coefficients,
	y = metaData[,1,1],
	type = "points",
	pch = point.type,
	cex = point.size,
	xlab = "Autocorrelation Coefficient",
	ylab = "R-Squared",
	xlim = c(-1,1),
	ylim = c(0,1))

for (i in 2:n.simulations)
{
	points(x = ar.coefficients, y = metaData[,i,1], pch = point.type,
		cex = point.size)
}

#	Now we add lines at the 5 and 1% significance levels.
significances <- c(0.95, 0.99)
f.values <- sapply(significances, function(x) {qf(x, 1, 98)})
denominator.dof <- n.points - 2
R2s <- (f.values / denominator.dof) / (1 + f.values / denominator.dof)
abline(a = R2s[1], 0, lty = 1, lwd = line.width)
abline(a = R2s[2], 0, lty = 2, lwd = line.width)

legend("center", c("p = 0.05", "p = 0.01"),
                  lty = c(1,2), lwd = line.width)

#	Close the graphics device.
dev.off()
