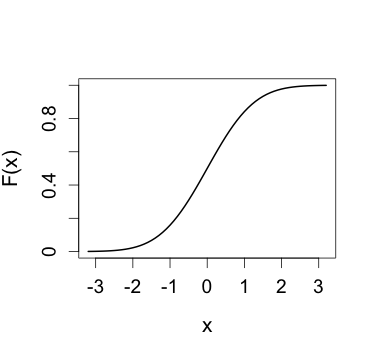
#  This script plots the CDF of a standard normal.

x.values <- seq(from = -3.2, to = 3.2, by = 0.1)
plot(x.values, pnorm(x.values), type = "l", lwd = 2,
     main = "", xlab = "x", ylab = "F(x)",
     xaxt = "n", yaxt = "n", cex.lab = 1.3)

#  Fix axes.
axis.size <- 1.2
axis(1, at = seq(from = -3, to = 3, by = 1), cex.axis = axis.size)
axis(2, at = seq(from = 0, to = 1, by = 0.2), cex.axis = axis.size)

dev.print(device = postscript, "3.5.png", horizontal = TRUE)
