% Creates two histograms of test scores under two different
% learning conditions.
%
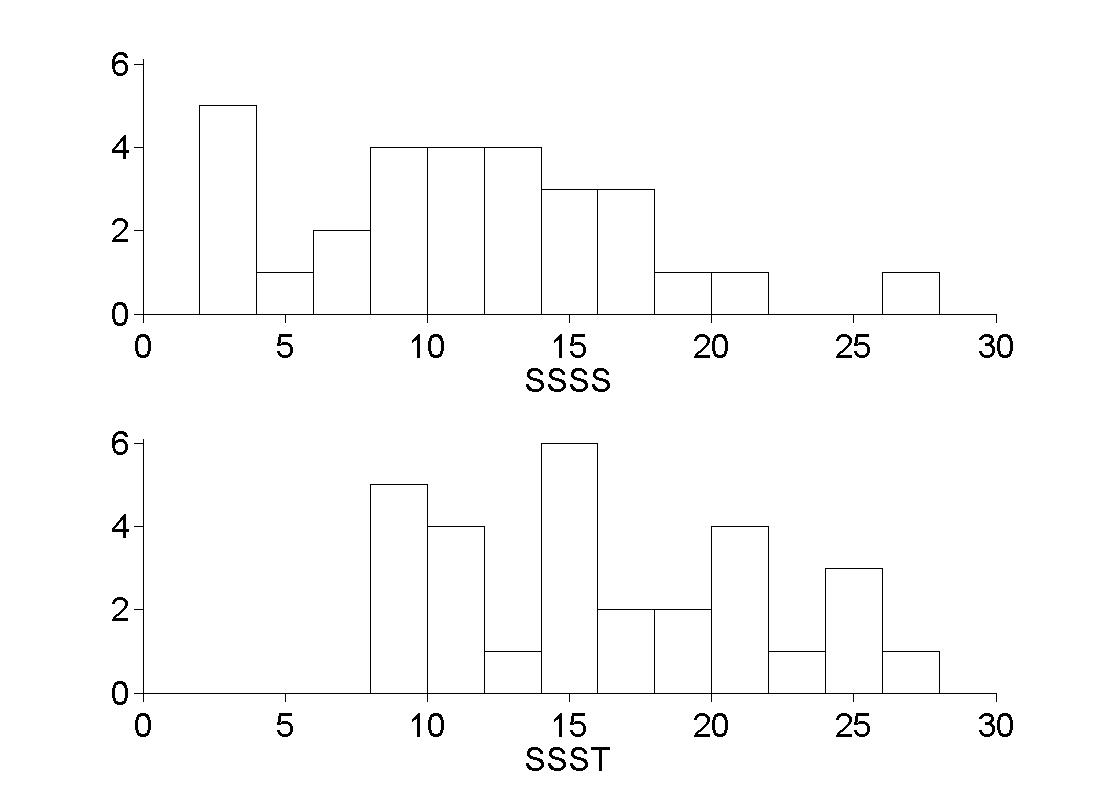
% Figure caption: Histograms of test-enhanced learning data. Data
% are assesment scores (number of recalled idea units, out of a
% maximum of 30) for 30 subjects under the SSSS condition (top)
% and the SSST condition (bottom). Data courtesy of
% J.D. Karpicke.
drk = csvread('rk.csv');
%% Histogram for SSSS Learning Condition %%
subplot(2, 1, 1)
hist(drk(2:end, 1), 3:2:29)
% Color histogram white.
rkhist1 = findobj(gca, 'Type', 'patch');
set(rkhist1, 'FaceColor', 'w', 'EdgeColor', 'k')
% More style and axes settings.
xlabel('SSSS', 'FontSize', 20)
set(gca, 'Box', 'off', 'FontSize', 20, ...
'XLim', [0, 30], 'YLim', [0, 6.1], ...
'XTick', 0:5:30, 'YTick', 0:2:6, 'TickDir', 'out')
%% Histogram for SSST Learning Condition %%
subplot(2, 1, 2)
hist(drk(2:end, 2), 9:2:29)
% Color histogram white.
rkhist2 = findobj(gca, 'Type', 'patch');
set(rkhist2, 'FaceColor', 'w', 'EdgeColor', 'k')
% More style and axes settings.
xlabel('SSST', 'FontSize', 20)
set(gca, 'Box', 'off', 'FontSize', 20, ...
'XLim', [0, 30], 'YLim', [0, 6.1], ...
'XTick', 0:5:30, 'YTick', 0:2:6, 'TickDir', 'out')
set(gcf, 'Position', [200, 100, 1100, 800])