% Creates a figure showing a binomial pdf overlapping the normal
% approximation to a binomial.
%
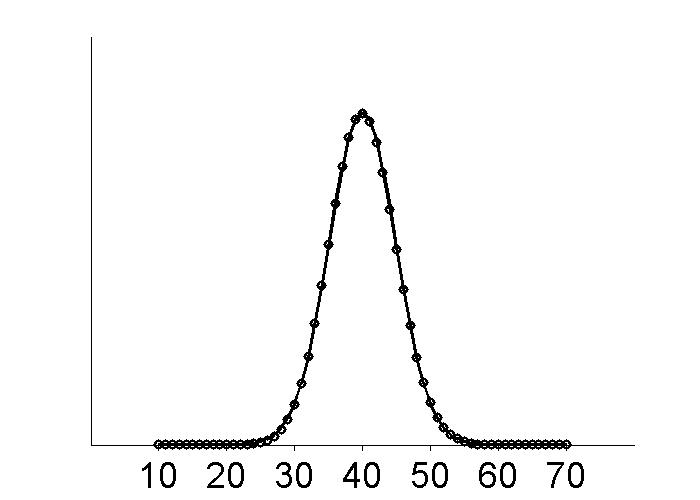
% Figure caption: The normal approximation to the binomial.
% Black circles are pdf values for a B(100, 0.4) distribution;
% the solid line is the pdf of a normal having the same mean and variance.
xvals = 10:70;
% Set binomial parameters.
n = 100;
p = 0.4;
binomialMean = p * n;
binomialVariance = n * p * (1 - p);
% Compute and plot PDFs.
binomialPdfValues = binopdf(xvals, n, p);
normalPdfValues = normpdf(xvals, binomialMean, sqrt(binomialVariance));
plot(xvals, normalPdfValues, '-k', 'LineWidth', 2)
hold on;
plot(xvals, binomialPdfValues, 'ok', 'MarkerSize', 5, 'LineWidth', 2)
% Set style parameters.
set(gca, 'Box', 'off', 'FontSize', 22, ...
'XTick', 10:10:70, 'YTick', [], 'TickDir', 'out')
set(gcf, 'Position', [200, 100, 700, 500])