% Script runs 1,000 simulations drawing a sample of size 100 from a
% Poisson distribution, and then plots histograms of the estimated
% means and estimated variances.
%
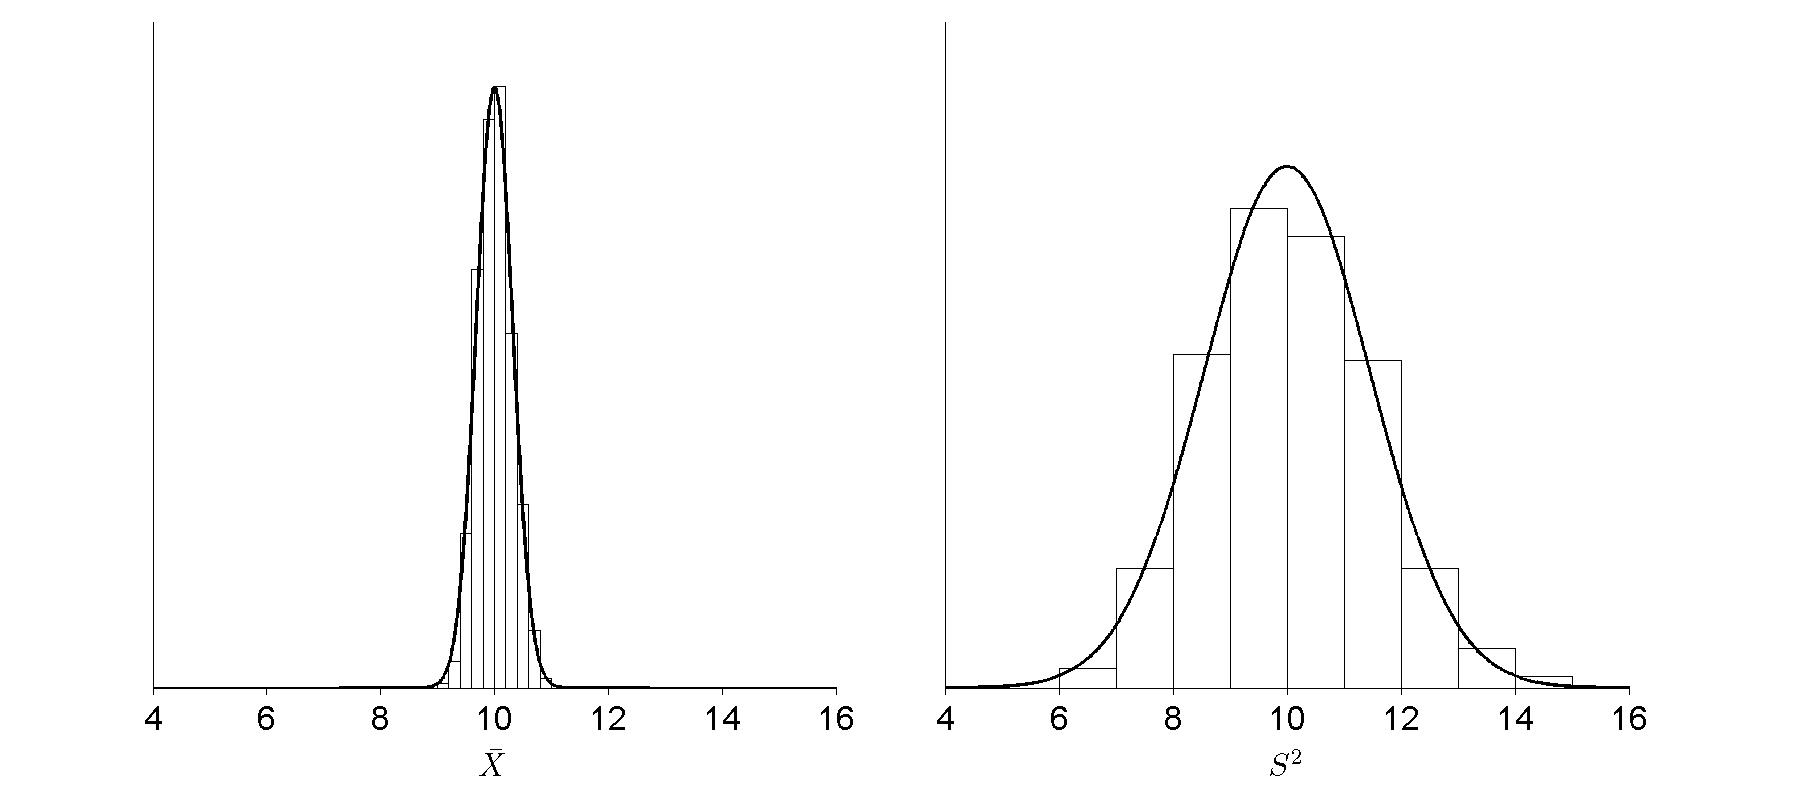
% Figure caption: Histograms siaplaying distributions of X-bar and S
% squared based on 1,000 randomly generated samples of size n = 100
% froma Poisson distribution with mean parameter mu = 10. In these
% repeated samples, both X-bat and S squared have distributions that
% are approximately normal. Both distributions are centered at 10
% (both estimators are unbiased) but the values of S squared
% fluctuate much more than do the values of X-bar.
nSimulations = 1000;
nSamples = 100;
lambda = 10;
% To obtain 1000 samples of size 100, we sample a matrix with 100
% rows and 1000 columns. Each column is a simulation.
psample = poissrnd(10, 100, 1000);
% mean and var, when the input is a matrix, by default takes the
% mean (or variance) across a column.
sampleMeans = mean(psample);
sampleVariances = var(psample);
x_vals = 4:0.01:16;
x_vals1 = 4.1:0.2:15.9;
x_vals2 = 4.5:1:15.5;
%% Histogram of sample means %%
subplot(1, 2, 1)
bar(x_vals1, hist(sampleMeans, x_vals1)./trapz(x_vals1, hist(sampleMeans, x_vals1)), 'style', 'hist')
set(gca, 'Box', 'off', 'FontSize', 20, ...
'XLim', [4, 16], ...
'XTick', 4:2:16, 'YTick', [], 'TickDir', 'out')
% Set faces to be white.
meanhist = findobj(gca, 'Type', 'patch');
set(meanhist, 'FaceColor', 'w')
y_vals1 = normpdf(x_vals, lambda, sqrt(lambda/nSamples));
hold on;
plot(x_vals, y_vals1, '-k', 'LineWidth', 2)
xlabel({''; '$\bar{X}$'}, 'Interpreter', 'LaTex', 'FontSize', 20)
% Position the device.
set(gcf, 'Position', [100, 100, 1800, 800])
set(gca,'OuterPosition',get(gca,'OuterPosition')+[-0.05, 0.025, 0.05, 0.025])
%% Histogram of sample variances %%
subplot(1, 2, 2)
bar(x_vals2, hist(sampleVariances, x_vals2)./trapz(x_vals2, hist(sampleVariances, x_vals2)), 'style', 'hist')
set(gca, 'Box', 'off', 'FontSize', 20, ...
'XLim', [4, 16], ...
'XTick', 4:2:16, 'YTick', [], 'TickDir', 'out')
% Set faces to be white.
varhist = findobj(gca, 'Type', 'patch');
set(varhist, 'FaceColor', 'w')
y_vals2 = normpdf(x_vals, lambda, sqrt((lambda/nSamples)+2*(lambda^2/(nSamples-1))));
hold on;
plot(x_vals, y_vals2, '-k', 'LineWidth', 2)
xlabel({''; '$S^2$'}, 'Interpreter', 'LaTex', 'FontSize', 20)
set(gca,'OuterPosition',get(gca,'OuterPosition')+[-0.05, 0.025, 0.05, 0.025])