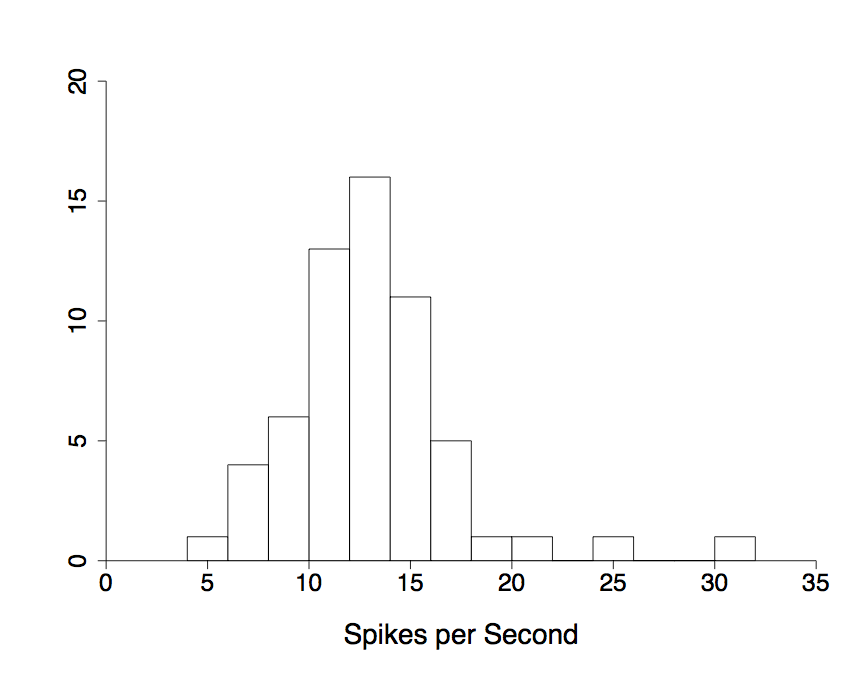
%  This file creates a histogram of spike counts from a cortical neuron in
%  the M1 motor area.  There are 60 trials, and the histogram records the
%  number of spikes in each trial.

spikeCounts = load('m1counts.csv');

%  Create a histogram with 14 bins.
hist(spikeCounts, 14)

% Set some graphical parameters and then find the patch corresponding to
% the histogram boxes, and set their color to white ('w').
set(gca,'Box','off', ...
        'FontSize', 22, ...
        'XLim', [0, 35], ...
        'YLim', [0, 20], ...
        'XTick', 0:5:35, ...
        'YTick', 0:5:20, ...
        'TickDir', 'out')
spikehist = findobj(gca, 'Type', 'patch');
set(spikehist, 'FaceColor', 'w')

% Set the graph label and determine the position (and size) of the figure.
% This figure will be placed 200 pixels from the left, 100 pixels from the
% top, and will be 500 pixels wide and 400 tall.
xlabel({'';'Spikes per Second'}, 'FontSize', 22)
set(gcf, 'Position', [200, 100, 700, 500])