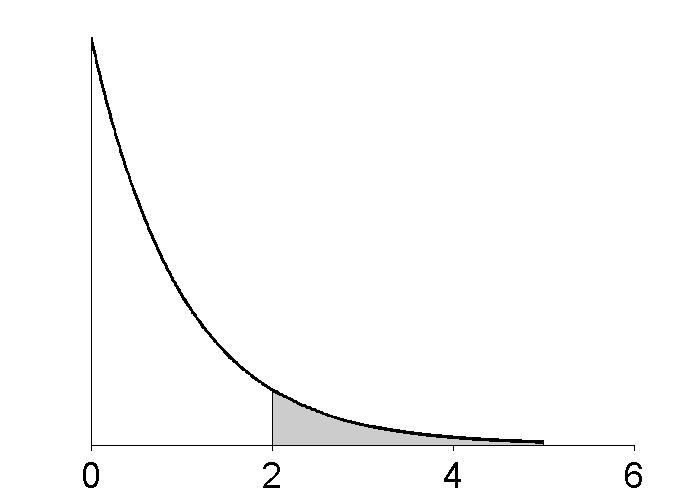
%  This script plots an exponential density, with some portion filled.
%  The area under the pdf for x values above 2 is shaded, and its area
%  gives P(X > 2).

%  Set expontial density parameters.
lambda = 1;
nx = 1000;

%  Choose a reasonable maximum x value to plot, using the inverse
%  cdf of the exponential.
xMax = ceil(expinv(0.99, 1/lambda));
xValues = 0:(xMax/nx):xMax;
pdfValues = exppdf(xValues, 1/lambda);

% Choose a point to shade pdf for P( x > point )
point = 2;
np = 1000;  %  Choose a high-enough resolution.

shadedRegionXValues = pointt:((xMax-point)/np):xMax;
pdfInRegion = exppdf(shadedRegionXValues, 1/lambda);

plot(xValues, pdfValues, '-k', 'LineWidth', 2)
set(gca, 'Box','off', 'FontSize', 22, 'YTick', [], 'TickDir', 'out')
hold on;

%  This shades the area between the pdf and the x axis.
shaded = area(shadedRegionXValues, pdfInRegion);
set(shaded,'FaceColor',[.8 .8 .8])
set(gcf, 'Position', [200, 100, 700, 500])
