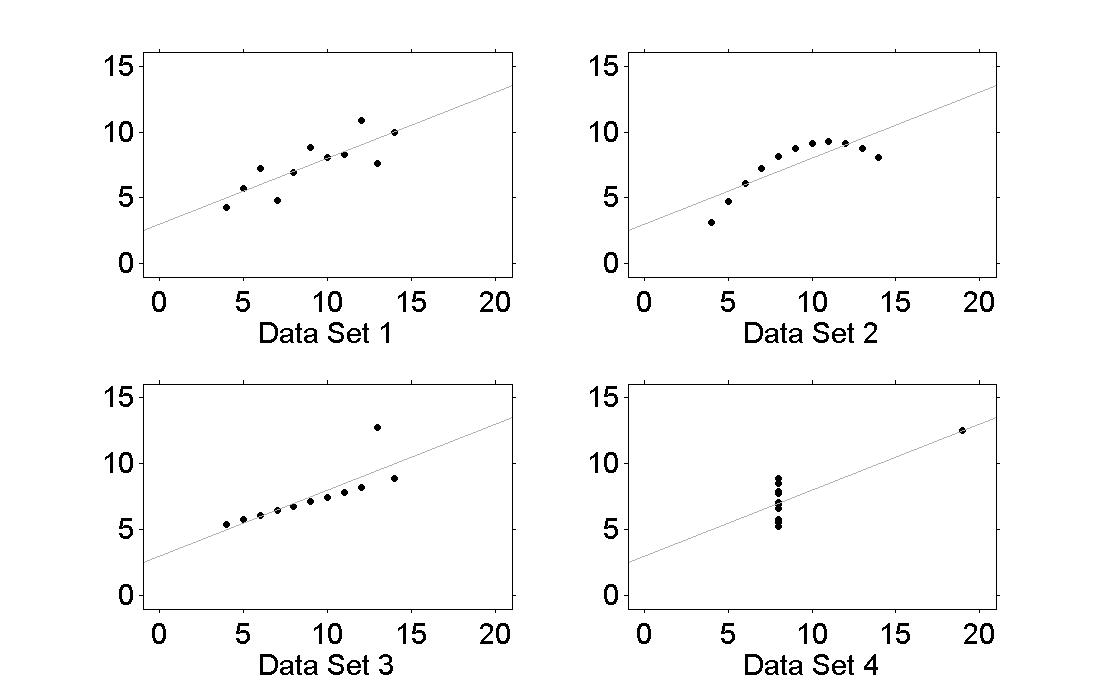
%  Plots Anscombe's data sets.


%  We need to load the data manually.
x123 = [10, 8, 13, 9, 11, 14, 6, 4, 12, 7, 5];
x4 = [8, 8, 8, 8, 8, 8, 8, 19, 8, 8, 8];
y1 = [8.04, 6.95, 7.58, 8.81, 8.33, 9.96, 7.24, 4.26, 10.84, 4.82, 5.68];
y2 = [9.14, 8.14, 8.74, 8.77, 9.26, 8.1, 6.13, 3.1, 9.13, 7.26, 4.74];
y3 = [7.46, 6.77, 12.74, 7.11, 7.81, 8.84, 6.08, 5.39, 8.15, 6.42, 5.73];
y4 = [6.58, 5.76, 7.71, 8.84, 8.47, 7.04, 5.25, 12.5, 5.56, 7.91, 6.89];


for i = 1:4

    subplot(2, 2, i)

    %  Plot data.
    plot(x(i, :), y(i, :), 'ok', 'MarkerSize', 4, 'MarkerFaceColor', 'k')
    set(gca, 'FontSize', 18, 'XLim', [-1, 21], 'YLim', [-1, 16], ...
             'XTick', 0:5:20, 'YTick', 0:5:15, 'TickDir', 'out')
    xlabel(strcat('Data Set ', int2str(i)), 'FontSize', 18)

    %  Add regression line.
    line1 = refline(0.5, 3);
    set(line1, 'Color', [0.7, 0.7, 0.7])


end

%  Set figure dimensions and close.
set(gcf, 'Position', [200, 100, 1100, 700])
