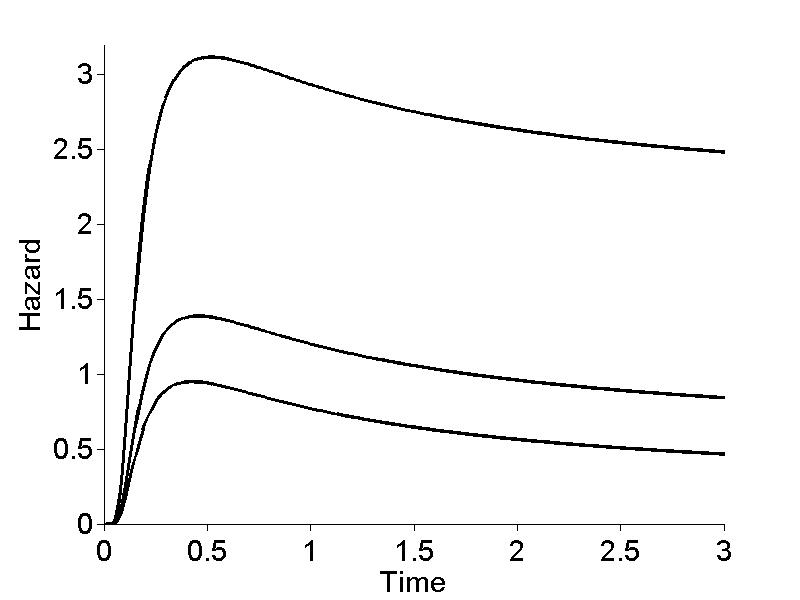
x_values = 0:0.01:3;

PD1 = ProbDistUnivParam('inversegaussian', [1, 1]);
PD2 = ProbDistUnivParam('inversegaussian', [0.49, 1]);
PD3 = ProbDistUnivParam('inversegaussian', [1.69, 1]);

h1 = pdf(PD1, x_values)./(1-cdf(PD1, x_values));
h2 = pdf(PD2, x_values)./(1-cdf(PD2, x_values));
h3 = pdf(PD3, x_values)./(1-cdf(PD3, x_values));

plot(x_values, h1, '-k', 'LineWidth', 2)
hold on;
plot(x_values, h2, '-k', 'LineWidth', 2)
plot(x_values, h3, '-k', 'LineWidth', 2)

set(gca,'Box','off', 'FontSize', 18, ...
        'XLim', [0, 3], 'YLim', [0, 3.2], ...
        'XTick', 0:0.5:3, 'YTick', 0:0.5:3, 'TickDir', 'out')

xlabel('Time', 'FontSize', 18)
ylabel('Hazard', 'FontSize', 18)

set(gcf, 'Position', [200, 100, 800, 600])