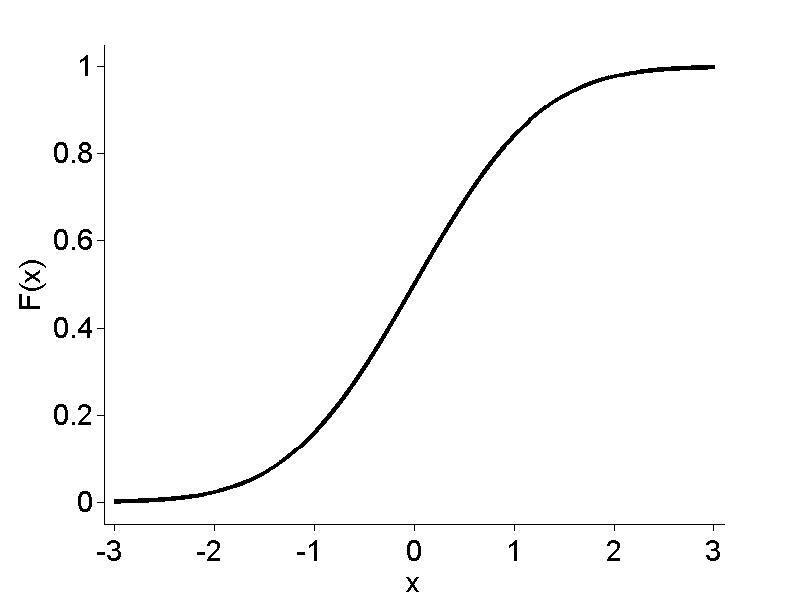
%  This script plots the CDF of a standard normal.

figure
set(gcf, 'Position', [200, 100, 800, 600])

xvals = -3:0.01:3;
plot(xvals, normcdf(xvals), '-k', 'LineWidth', 3)
set(gca,'Box','off', 'FontSize', 18, ...
        'XLim', [-3.1, 3.1], 'YLim', [-0.05, 1.05], ...
        'XTick', -3:1:3, 'YTick', 0:0.2:1, 'TickDir', 'out')

xlabel('x', 'FontSize', 18)
ylabel('F(x)', 'FontSize', 18)
