First, some boxplots.
> motif()
> attach(singers.frame)
> plot(Part, Height)
> title(main="Singers' Heights")
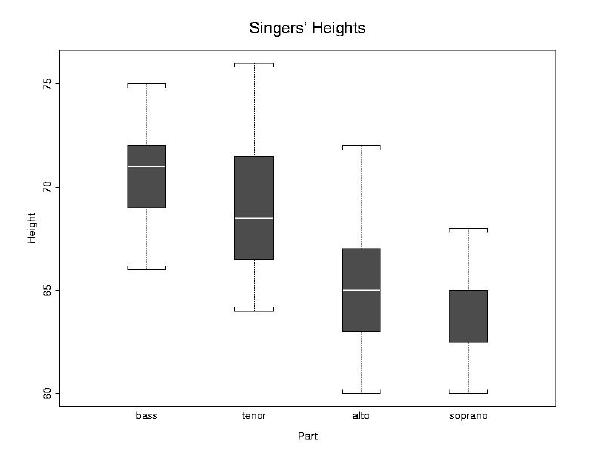
Note that if part had not been coded as an ordered factor
the boxplots would have been in alphabetical order. If it had not been coded
as a factor at all, S-PLUS would have made dotplots instead of boxplots.
> t.test(Height[Part=="soprano"],Height[Part=="alto"])These t-tests show that there is no significant difference in mean height between sopranos and altos, but that mean height for basses is significantly higher than mean height for tenors.
Standard Two-Sample t-Test
data: Height[Part == "soprano"] and Height[Part == "alto"]
t = -1.1289, df = 69, p-value = 0.2628
alternative hypothesis: true difference in means is not equal to 0
95 percent confidence interval:
-1.7591030 0.4876745
sample estimates:
mean of x mean of y
64.25 64.88571
> t.test(Height[Part=="tenor"],Height[Part=="bass"])
Standard Two-Sample t-Test
data: Height[Part == "tenor"] and Height[Part == "bass"]
t = -2.1297, df = 57, p-value = 0.0375
alternative hypothesis: true difference in means is not equal to 0
95 percent confidence interval:
-3.04220979 -0.09368765
sample estimates:
mean of x mean of y
69.15 70.71795