## Author: Elan Cohen (edc@stat.cmu.edu)
## Date: 1/22/08
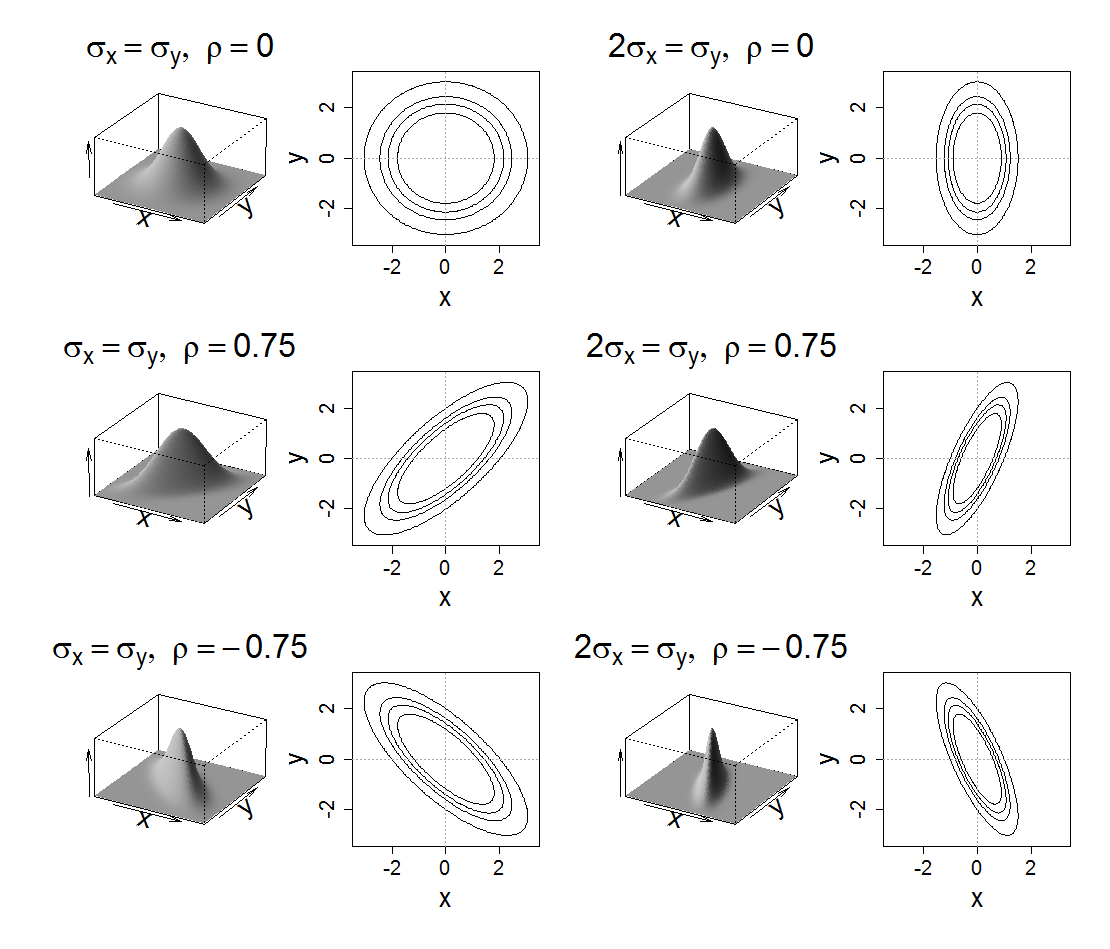
## Goal: Produce example perspective and contour plots of the bivariate
## Normal distribution.
## Run: > source("bivariate-normal.r")
### Start: Function definitions ###
## Calculated bivariate normal density at /one/ point (x,y).
## Must pass full covariance matrix (Sig), or sd1, sd2 and rho.
## See below.
fxy = function(x, y, mu, Sig, sd1, sd2, rho) {
if(missing(mu)) mu=c(0,0)
if(!missing(Sig)) {
sd1 = sqrt(Sig[1,1])
sd2 = sqrt(Sig[2,2])
if(Sig[1,2] != Sig[2,1]) {
print("Covariance matrix is not symmetric... Returning .")
return(NULL)
}
rho = Sig[1,2]/(sd1*sd2)
}
else if(missing(rho) || missing(sd1) || missing(sd2)) {
sd1 = sd2 = 1
rho = 0
}
Q = (x-mu[1])^2/sd1^2 + (y-mu[2])^2/sd2^2 -
2*rho*(x-mu[1])*(y-mu[2])/(sd1*sd2)
1/(2*pi*sd1*sd2*sqrt(1-rho^2))*exp(-Q/(2*(1-rho^2)))
}
## Calls persp() with preferred arguments
persp.plot = function(x, y, z, main="Bivariate Normal Density",
theta=30, phi=25, r=50, d=.1, expand=0.5, ltheta=90, lphi=180,
shade=0.5, ticktype="simple", nticks=5, col="lightgreen", zlab="", ...) {
persp(x, y, z, main=main,
theta=theta, phi=phi, r=r, d=d, expand=expand, ltheta=ltheta,
lphi=lphi, shade=shade, ticktype=ticktype, nticks=nticks,
col=col, zlab=zlab, ...)
}
## Creates covariance matrix from sd.x, sd.y, and rho
calc.Sig = function(sd.x, sd.y, rho) {
sig.xy = rho*sd.x*sd.y
matrix(c(sd.x^2, sig.xy, sig.xy, sd.y^2), nrow=2)
}
## Returns bivariate normal density for specified x-y grid
dmvnorm = function(x, y, mu, Sig) {
if(missing(mu)) mu = c(0,0)
if(missing(Sig)) Sig = diag(2)
outer(x, y, fxy, mu, Sig)
}
## This is only the kernel of the bivariate Normal density
## x is a 2x1 vector
f = function(x, y, mu=c(0,0), sd.x=1, sd.y=1, rho=0) {
#t(X-mu)%*%solve(Sig)%*%(X-mu)
mu.x = mu[1]
mu.y = mu[2]
A = (x-mu.x)^2/sd.x^2 + (y-mu.y)^2/sd.y^2
B = 2*rho/(sd.x*sd.y)*(x-mu.x)*(y-mu.y)
return((A-B)/(1-rho^2))
}
### End: Function definitions ###
### Create perspective and contour plots
## The value of N affects the density of lines and hence the darkness.
## Unfortunately, small values of N result in a rough plot, while large values
## result in a dark plot. This is also dependent on the size of the X window
## (a large window size will appear lighter than a smaller window size for a
## fixed N). If 'border=NA' is set, these lines don't appear.
N = 100
x = y = seq(-3.2,3.2,le=N) # create x-y grid of size NxN
mu = c(0,0)
## Define sequence of parameters
n.plot = 6
rho.seq = rep(c(0, 0.75, -0.75), 2)
sd.x.seq = rep(c(1, .5), each=n.plot/2)
sd.y.seq = rep(1, n.plot)
expr.seq = c(expression(list(sigma[x]==sigma[y], ~rho==0)),
expression(list(sigma[x]==sigma[y], ~rho==0.75)),
expression(list(sigma[x]==sigma[y], ~rho==-0.75)),
expression(list(2*sigma[x]==sigma[y], ~rho==0)),
expression(list(2*sigma[x]==sigma[y], ~rho==0.75)),
expression(list(2*sigma[x]==sigma[y], ~rho==-0.75)))
p.seq = c(.8, .9, .95, .99)
cont.lev = qchisq(p.seq, 2)
cont.lab = c("80%", "90%", "95%", "99%")
## Plotting starts here
postscript(file="bivariateNormalR.ps", horizontal=F,
width=7, height=10.5, onefile=F) # 1.5:1 aspect ratio
par(cex.lab=2)
par(cex.axis=1.75)
par(las=1)
par(mfrow=c(3,2)) # 1.5:1 aspect ratio
for(j in 1:n.plot) {
## Perspective Plot
z = dmvnorm(x, y, mu, calc.Sig(sd.x.seq[j], sd.y.seq[j], rho.seq[j]))
persp.plot(x, y, z, main="", col="lightblue", border=NA, cex.lab=1.5,
axes=F)
mtext(expr.seq[j])
## Contour Plot
z = outer(x, y, f, mu, sd.x.seq[j], sd.y.seq[j], rho.seq[j])
contour(x, y, z, levels=cont.lev, cex.axis=1.4, labels=cont.lab,
xlab="x", ylab="y", cex.lab=1.5)
abline(v=0, h=0, lty=3, col="darkgrey")
}
dev.off()
### EOF ###